
BAG’s latest premium release gave us an opportunity to explore how premiums are changing across Switzerland.
We put together a small interactive example showing the changes from 2026 to 2027, with regional history back to 2022. You can explore your municipality or select an insurer to see its development alongside the market median. There’s also a population view: places with more residents take up more space, offering a different perspective from the geographic map.
The example uses fixed insurance settings and our own calculations based on public data. Click here or on the image below to go to the usecase.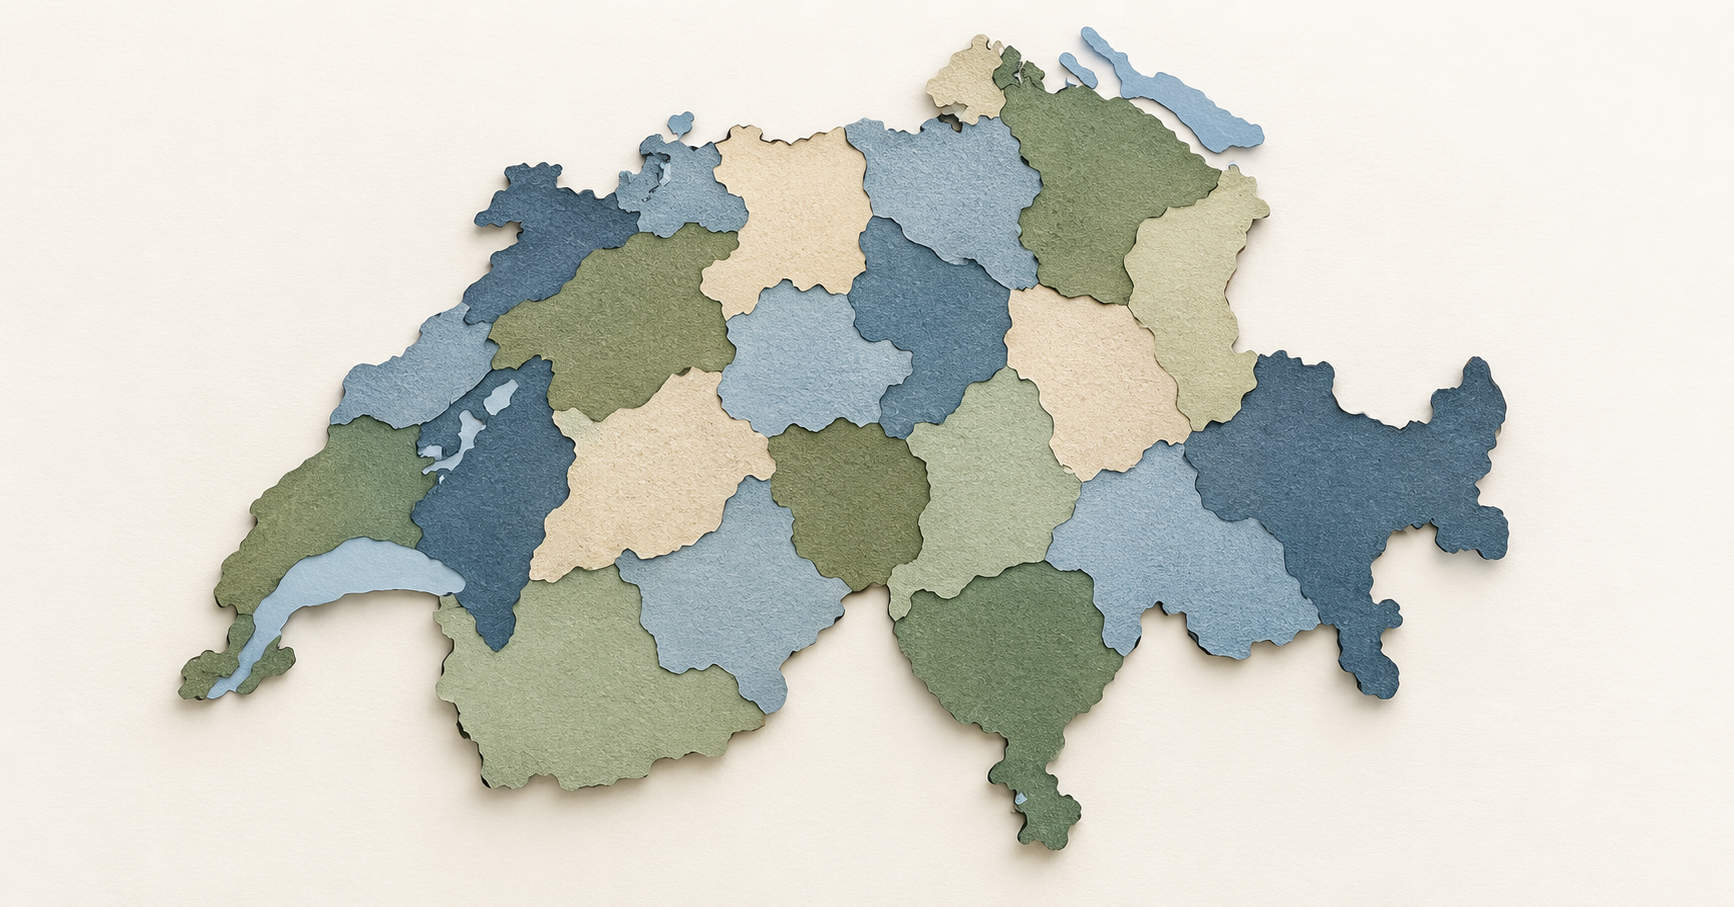
We put together a small interactive example showing the changes from 2026 to 2027, with regional history back to 2022. You can explore your municipality or select an insurer to see its development alongside the market median. There’s also a population view: places with more residents take up more space, offering a different perspective from the geographic map.
The example uses fixed insurance settings and our own calculations based on public data. Click here or on the image below to go to the usecase.